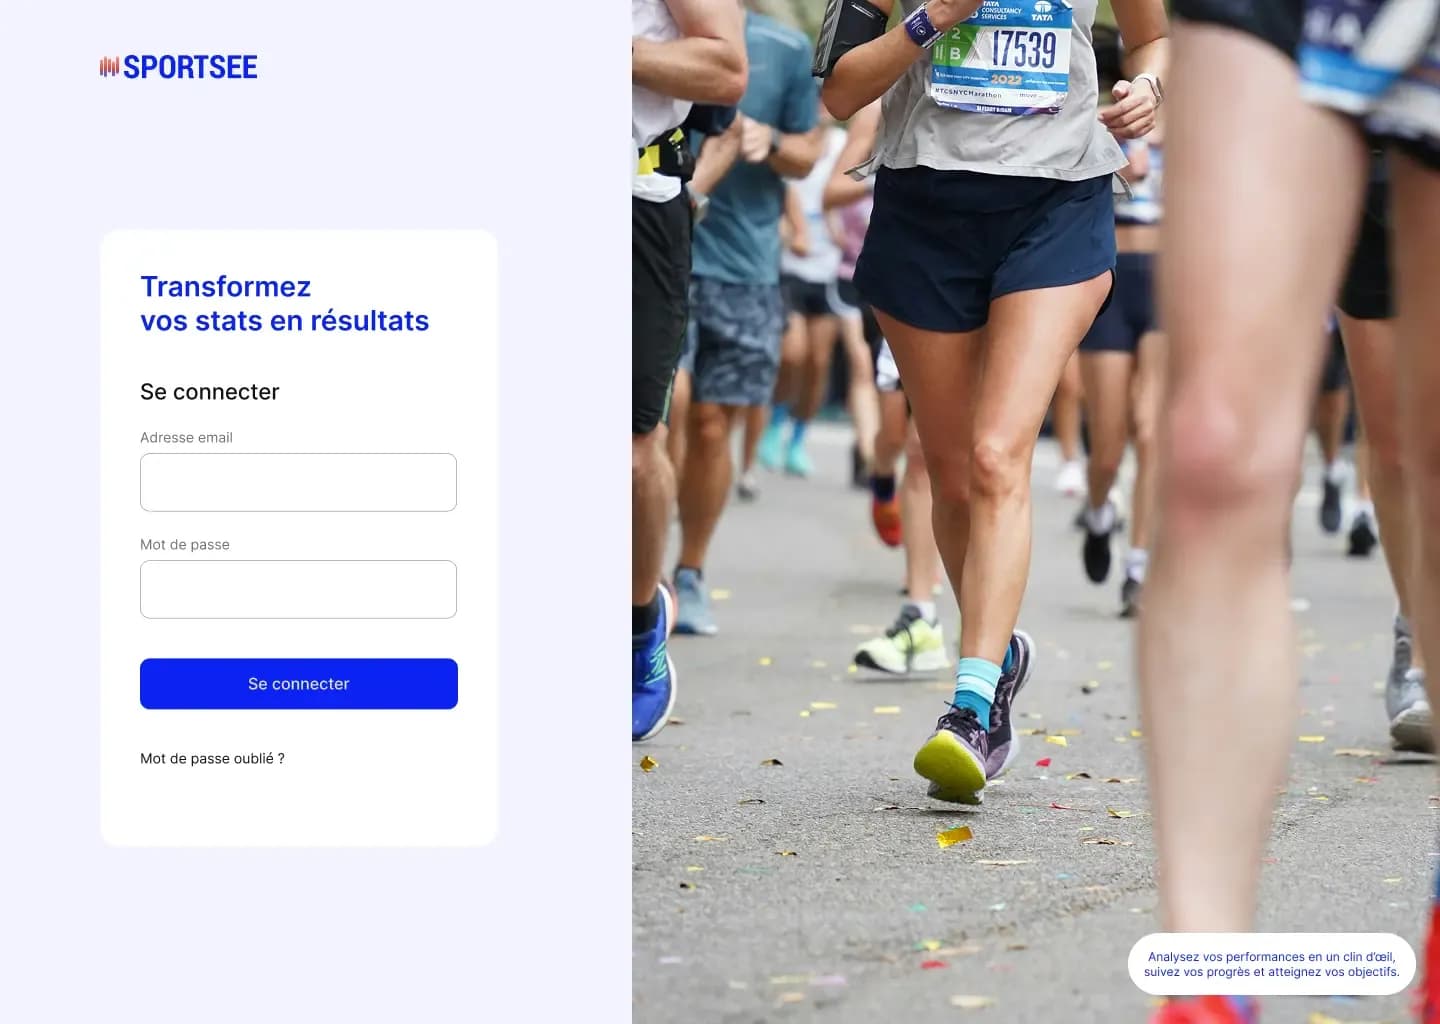
Creation of a sports tracking interface in React, featuring authentication, routing, centralized API calls, and data visualization through interactive charts.

Click to enlarge — scroll horizontally to explore
OpenClassrooms project context :
As a front-end developer at SportSee, I was tasked with developing a new version of the user profile pages for a sports coaching application. The goal was to allow users to view their personal statistics, such as completed sessions or calories burned, through a modern interface focused on data visualization.
The project required building a complete React interface based on Figma mockups and an existing Node.js backend. Several challenges had to be handled at the same time: page navigation, authentication, user data retrieval, data normalization before display, and the integration of readable and performant charts. Another key requirement was to isolate HTTP calls outside of the components in order to maintain a clean architecture.
I developed the profile pages in React by structuring the application around a clear and maintainable logic.
More specifically, I:
The application allows users to clearly visualize their main sports metrics through a modern, structured, and component-based interface. This project helped me strengthen my skills in React, front-end architecture, global state management, and API consumption in a context close to a real product application.