Definition of the technical architecture, implementation of a monitoring system, and full project management of a WordPress e-commerce project, including Gantt planning and Kanban tracking.

OpenClassrooms project context :
As a developer at Emoving, a startup specializing in electric mobility, I contributed to the design of the company’s future e-commerce website following a fundraising round. The project involved collaboration with UX, design, and development profiles, with the objective of structuring a robust and scalable technical solution before launch.
The project required defining a complete technical architecture, justifying the chosen solutions to the board, and structuring the entire project before the development phase. It was also necessary to set up an effective technology watch process, select suitable project management tools, and organize a clear roadmap covering all e-commerce features, including the catalog, payment system, configurator, and customer account area.
I was responsible for structuring the project from both a technical and organizational perspective.
More specifically, I:
The project was structured in a clear and actionable way for both the team and the board. The technical choices were well justified, the monitoring system helped anticipate market developments, and the project management tools provided full visibility into progress. This mission allowed me to develop a broader product vision combining technical, organizational, and strategic thinking.

Use case
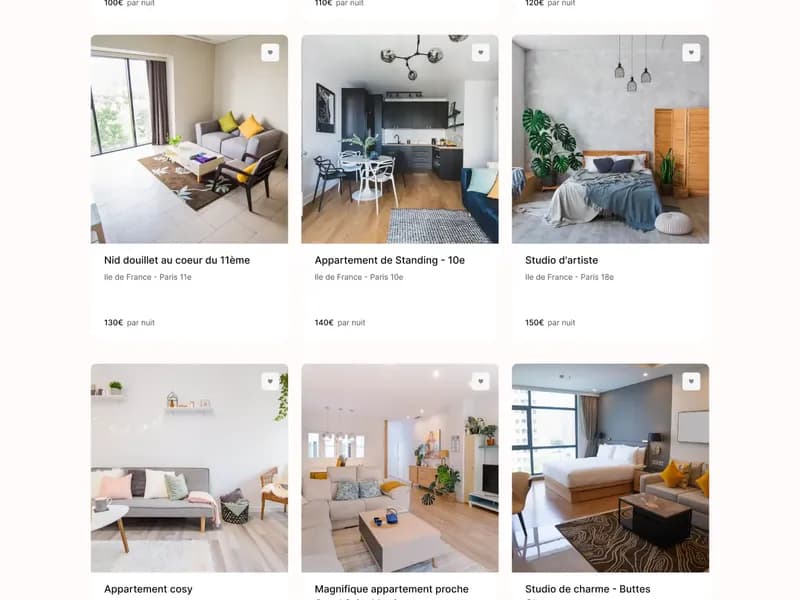
Development of Kasa’s new interface in Next.js, connected to an Express API, including property management, favorites, authentication, real-time messaging, and host-side user flows.

Use case
Creation of a SaaS project management interface with Next.js, including a multi-view dashboard, advanced collaborative features, and UX enhancements such as drag and drop, autocomplete, testing, and deployment.

Use case
Creation of a sports tracking interface in React, featuring authentication, routing, centralized API calls, and data visualization through interactive charts.